
viz_utils
- virtualitics_sdk.utils.viz_utils.create_bar_plot(data_frame, x_axis_key, y_axis_key, plot_title, plot_description='', show_tooltip=True, include_keys_tooltip=None, exclude_keys_tooltip=None, x_axis_orientation=XAxisOrientation.BOTTOM, y_axis_orientation=YAxisOrientation.LEFT, x_axis_scale=PlotAxisScale.AUTO, y_axis_scale=PlotAxisScale.LINEAR, x_axis_label=None, y_axis_label=None, color_by=None, bounds=None, color_by_category=True, show_title=True, show_description=True, colors=None, advanced_tooltip=None, legend=None, lines=None, **kwargs)
Generates a Bar Plot for using Virtualitics AI Platform’s Visualization Framework.
- Parameters:
data_frame (
Union[Dataset,DataFrame]) – The data that should be plotted. NOTE: Rows with NaN will be filtered out.x_axis_key (
str) – The name of the column for the X-Axis.y_axis_key (
str) – The name of the column for the Y-Axis.plot_title (
str) – The title of the plot.plot_description (
str) – The description of the plot, defaults to “”.show_tooltip (
bool) – whether to show the tooltip, defaults to True.include_keys_tooltip (
Optional[List[str]]) – Keys to include on tooltip, defaults to all keys.exclude_keys_tooltip (
Optional[List[str]]) – Keys to exclude on tooltip, defaults to including all keys.x_axis_orientation (
XAxisOrientation) – The orientation of the X-Axis, defaults to XAxisOrientation.BOTTOM.y_axis_orientation (
YAxisOrientation) – The orientation of the Y-Axis, defaults to YAxisOrientation.LEFT.x_axis_scale (
PlotAxisScale) – The scale of the X-Axis, defaults to PlotAxisScale.AUTO.y_axis_scale (
PlotAxisScale) – The scale of the Y-Axis, defaults to PlotAxisScale.LINEAR.x_axis_label (
Optional[str]) – The label for the X-axis, defaults to x_axis_key.y_axis_label (
Optional[str]) – The label for the Y-axis, defaults to y_axis_key.color_by (
Optional[str]) – The column to use to color the plot if coloring, defaults to None (no coloring).bounds (
Optional[Dict[str,List[Union[str,int]]]]) – The bounds of the data range if they should be manually set. This is a dict that contains they key as a string and a list of two numbers as min and max range. A list of strings is also accepted for categorical values, defaults to None. For example {x_axis_key: [0, 100], y_axis_key: [50, 200]}color_by_category (
bool) – When true, the color by axis will be categorical (if set).show_title (
bool)show_description (
bool)colors (
Optional[List[str]]) – The hex color schema a plot should use, defaults to None (Virtualitics AI Platform default colors).advanced_tooltip (
Optional[Callable[[dict],List[Union[Element,str]]]]) – The function to call that creates an advanced tooltip. This functions takes a dict containing the data point and returns a list of elements (Plots, Infographics Tables, Infographics, CustomEvents) or strings which are rendered as markdown, defaults to Nonelegend (
Optional[List[str]]) – A list to represent the order and labels on the legend. Will default to order present in plot data.lines (
Optional[List[Dict[str,Union[LineType,str,Any]]]]) – A list of dictionaries containing information on parameters for the creation of a line on the plot. Each dictionary in the list denotes a different line. The currently supported line types are ‘horizontal’, ‘vertical’, and ‘linear’, where a ‘linear’ line denotes a linear trend line fitted to the data. The dictionary must be specify the line type using a LineType enum and can specify additional parameters relevant each line type. See the constructors for the HorizontalLine, VerticalLine, and OLSTrendLine for more information. For exmaple, a dictionary for a linear trend line could look like: {“type”: LineType.LINEAR, “description”: “My trendline”, “time_series_unit”: pd.Timedelta(“1 hours”)}.
- Return type:
- Returns:
A newly created bar plot.
EXAMPLE:
# Imports
from virtualitics_sdk import create_bar_plot
...
# Example usage
df = pd.read_csv("some/example/path.csv")
ex_bar = create_bar_plot(df,
                         "sepal.length",
                         "sepal.width",
                         "Sepal Length vs. Sepal Width")
card = Card("Example", [ex_bar])
- virtualitics_sdk.utils.viz_utils.create_histogram_plot(data_frame, data_column, plot_title, plot_description='', bins='auto', frequency=False, show_tooltip=True, include_keys_tooltip=None, exclude_keys_tooltip=None, x_axis_orientation=XAxisOrientation.BOTTOM, y_axis_orientation=YAxisOrientation.LEFT, x_axis_scale=PlotAxisScale.AUTO, y_axis_scale=PlotAxisScale.LINEAR, x_axis_label=None, y_axis_label=None, color_by=None, bounds=None, color_by_category=True, show_title=True, show_description=True, _id=None, colors=None, advanced_tooltip=None, lines=None, legend=None, **kwargs)
Generates a Histogram Plot using Virtualitics AI Platform’s Visualization Framework.
- Parameters:
data_frame (
Union[Dataset,DataFrame]) – The data that should be plotted. NOTE: Rows with NaN will be filtered out.data_column (
str) – The name of the column whose data will be plotted in the histogram.plot_title (
str) – The title of the plot.plot_description (
str) – The description of the plot, defaults to “”.bins (
Union[int,Sequence[Union[int,float,number]],str]) – If an integer is provided, this is number of bins to to plot in the histogram. If a sequence of numbers is provided, these denote the edges of the bins, including the right most edge. If a string is provided, a binning algorithm is used to determine the number of bins based on the data’s distribution. More details can be found here, defaults to ‘auto’.frequency (
bool) – Determines whether to plot a histogram based on counts or frequency. If False, the histogram is plotted using counts in each bin. If True, uses frequency instead, defaults to False.show_tooltip (
bool) – whether to show the tooltip, defaults to True.include_keys_tooltip (
Optional[List[str]]) – Keys to include on tooltip, defaults to all keys.exclude_keys_tooltip (
Optional[List[str]]) – Keys to exclude on tooltip, defaults to including all keys.x_axis_orientation (
XAxisOrientation) – The orientation of the X-Axis, defaults to XAxisOrientation.BOTTOM.y_axis_orientation (
YAxisOrientation) – The orientation of the Y-Axis, defaults to YAxisOrientation.LEFT.x_axis_scale (
PlotAxisScale) – The scale of the X-Axis, defaults to PlotAxisScale.AUTO.y_axis_scale (
PlotAxisScale) – The scale of the Y-Axis, defaults to PlotAxisScale.LINEAR.x_axis_label (
Optional[str]) – The label for the X-axis, defaults to x_axis_key.y_axis_label (
Optional[str]) – The label for the Y-axis, defaults to y_axis_key.color_by (
Optional[str]) – The column to use to color the plot if coloring, defaults to None (no coloring).bounds (
Optional[Dict[str,List[Union[str,int]]]]) – The bounds of the data range if they should be manually set. This is a dict that contains they key as a string and a list of two numbers as min and max range. A list of strings is also accepted for categorical values, defaults to None. For example {x_axis_key: [0, 100], y_axis_key: [50, 200]}color_by_category (
bool) – When true, the color by axis will be categorical (if set).show_title (
bool)show_description (
bool)_id (
Optional[str]) – The ID of the plot, defaults to None.colors (
Optional[List[str]]) – The hex color schema a plot should use, defaults to None (Virtualitics AI Platform default colors).advanced_tooltip (
Optional[Callable[[dict],List[Union[Element,str]]]]) – The function to call that creatse an advanced tooltip. This functions takes a dict containing the data point and returns a list of elements (Plots, Infographics Tables, Infographics, CustomEvents) or strings which are rendered as markdown, defaults to Nonelines (
Optional[List[Dict[str,Union[LineType,str,Any]]]]) – A list of dictionaries containing information on parameters for the creation of a line on the plot. Each dictionary in the list denotes a different line. The currently supported line types are ‘horizontal’, ‘vertical’, and ‘linear’, where a ‘linear’ line denotes a linear trend line fitted to the data. The dictionary must be specify the line type using a LineType enum and can specify additional parameters relevant each line type. See the constructors for the HorizontalLine, VerticalLine, and OLSTrendLine for more information. For exmaple, a dictionary for a linear trend line could look like: {“type”: LineType.LINEAR, “description”: “My trendline”, “time_series_unit”: pd.Timedelta(“1 hours”)}.legend (
Optional[List[str]]) – A list to represent the order and labels on the legend. Will default to order present in plot data.
- Return type:
- Returns:
A newly created bar plot.
EXAMPLE:
# Imports
from virtualitics_sdk import create_histogram_plot
. . .
# Example usage
df = pd.read_csv("some/example/path.csv")
ex_histogram_plot = create_histogram_plot(df,
                                          "sepal.length",
                                          "Sepal Length Distribution",
                                          advanced_tooltip=bar_tooltip)
card = Card("Example",[ex_histogram_plot])
- virtualitics_sdk.utils.viz_utils.create_line_plot(data_frame, x_axis_key, y_axis_key, plot_title, plot_description='', show_tooltip=True, include_keys_tooltip=None, exclude_keys_tooltip=None, x_axis_orientation=XAxisOrientation.BOTTOM, y_axis_orientation=YAxisOrientation.LEFT, x_axis_scale=PlotAxisScale.AUTO, y_axis_scale=PlotAxisScale.LINEAR, x_axis_label=None, y_axis_label=None, color_by=None, bounds=None, color_by_category=True, show_title=True, show_description=True, colors=None, advanced_tooltip=None, lines=None, legend=None, **kwargs)
Generates a Line Plot for using Virtualitics AI Platform’s Visualization Framework.
- Parameters:
data_frame (
Union[Dataset,DataFrame]) – The data that should be plotted. NOTE: Rows with NaN will be filtered out.x_axis_key (
str) – The name of the column for the X-Axis.y_axis_key (
str) – The name of the column for the Y-Axis.plot_title (
str) – The title of the plot.plot_description (
str) – The description of the plot, defaults to “”.show_tooltip (
bool) – whether to show the tooltip, defaults to True.include_keys_tooltip (
Optional[List[str]]) – Keys to include on tooltip, defaults to all keys.exclude_keys_tooltip (
Optional[List[str]]) – Keys to exclude on tooltip, defaults to including all keys.x_axis_orientation (
XAxisOrientation) – The orientation of the X-Axis, defaults to XAxisOrientation.BOTTOM.y_axis_orientation (
YAxisOrientation) – The orientation of the Y-Axis, defaults to YAxisOrientation.LEFT.x_axis_scale (
PlotAxisScale) – The scale of the X-Axis, defaults to PlotAxisScale.AUTO.y_axis_scale (
PlotAxisScale) – The scale of the Y-Axis, defaults to PlotAxisScale.LINEAR.x_axis_label (
Optional[str]) – The label for the X-axis, defaults to x_axis_key.y_axis_label (
Optional[str]) – The label for the Y-axis, defaults to y_axis_key.color_by (
Optional[str]) – The column to use to color the plot if coloring, defaults to None (no coloring).bounds (
Optional[Dict[str,List[Union[str,int]]]]) – The bounds of the data range if they should be manually set. This is a dict that contains the key as a string and a list of two numbers as min and max range. A list of strings is also accepted for categorical values, defaults to None. For example {x_axis_key: [0, 100], y_axis_key: [50, 200]}color_by_category (
bool) – When true, the color by axis will be categorical (if set).show_title (
bool)show_description (
bool)colors (
Optional[List[str]]) – The hex color schema a plot should use, defaults to None (Virtualitics AI Platform default colors).advanced_tooltip (
Optional[Callable[[dict],List[Union[Element,str]]]]) – The function to call that creatse an advanced tooltip. This functions takes a dict containing the data point and returns a list of elements (Plots, Infographics Tables, Infographics, CustomEvents) or strings which are rendered as markdown, defaults to Nonelines (
Optional[List[Dict[str,Union[LineType,str,Any]]]]) – A list of dictionaries containing information on parameters for the creation of a line on the plot. Each dictionary in the list denotes a different line. The currently supported line types are ‘horizontal’, ‘vertical’, and ‘linear’, where a ‘linear’ line denotes a linear trend line fitted to the data. The dictionary must be specify the line type using a LineType enum and can specify additional parameters relevant each line type. See the constructors for the HorizontalLine, VerticalLine, and OLSTrendLine for more information. For exmaple, a dictionary for a linear trend line could look like: {“type”: LineType.LINEAR, “description”: “My trendline”, “time_series_unit”: pd.Timedelta(“1 hours”)}.legend (
Optional[List[str]]) – A list to represent the order and labels on the legend. Will default to order present in plot data.
- Return type:
- Returns:
A newly created line plot.
EXAMPLE:
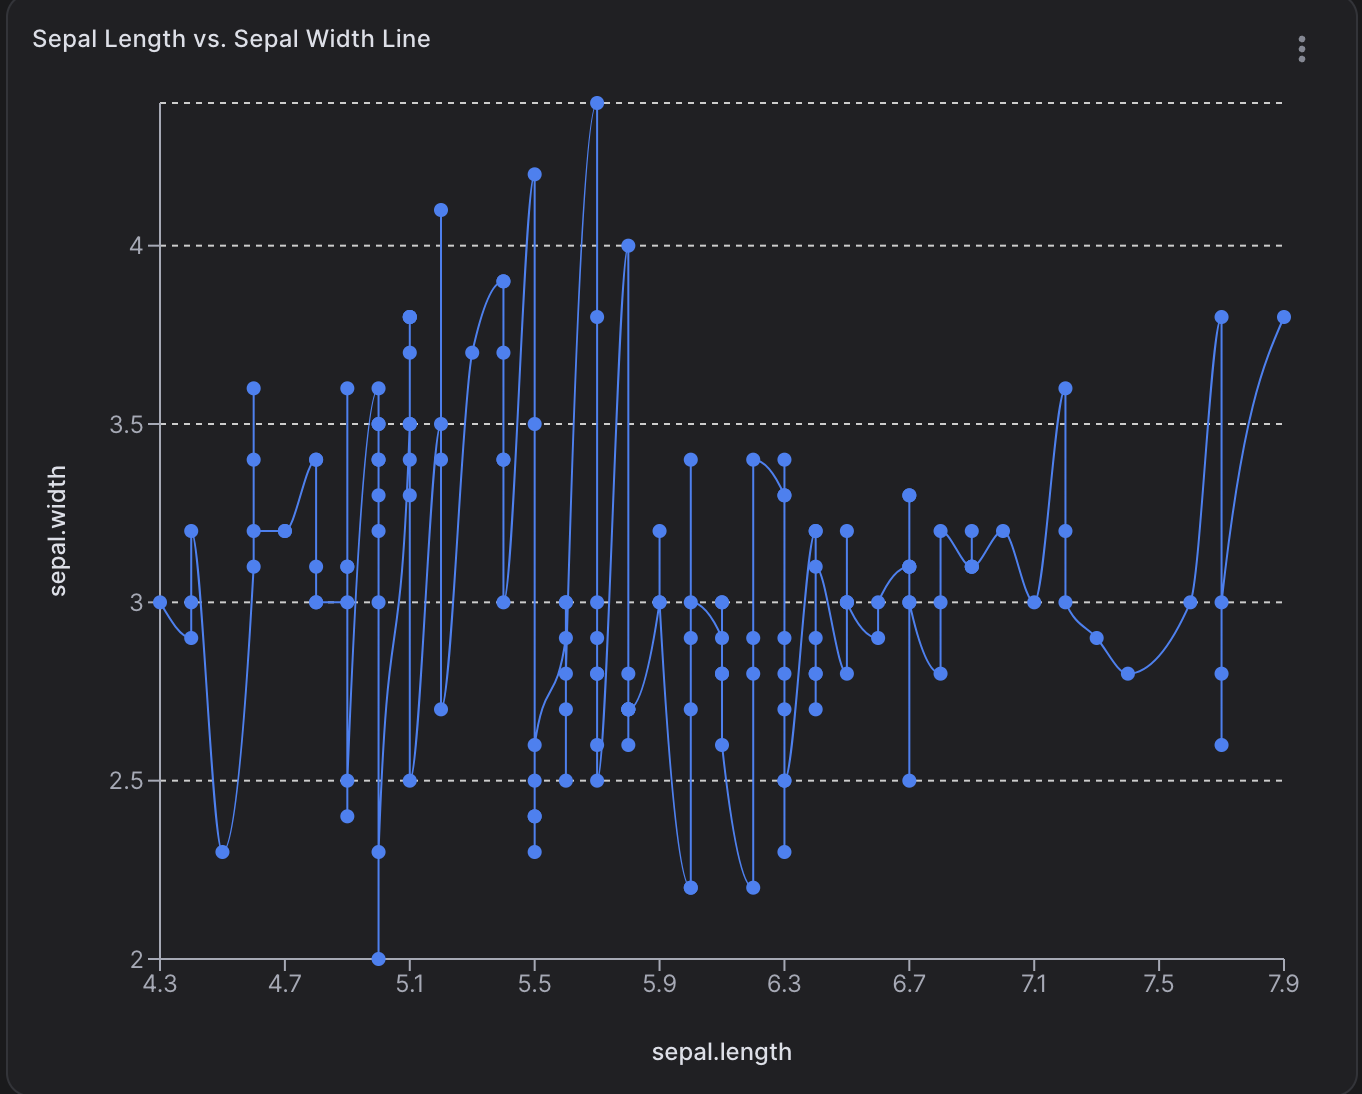
# Imports
from virtualitics_sdk import create_line_plot
. . .
df = pd.read_csv("some/example/path.csv")
ex_line_plot = create_line_plot(df,
                                "sepal.length",
                                "sepal.width",
                                "Sepal Length vs. Sepal Width Line")
card = Card("",[ex_line_plot])
The above plot will be displayed as:
- virtualitics_sdk.utils.viz_utils.create_plot(plot_type, data_frame, x_axis_key, y_axis_key, plot_title, plot_description='', show_tooltip=True, include_keys_tooltip=None, exclude_keys_tooltip=None, x_axis_orientation=XAxisOrientation.BOTTOM, y_axis_orientation=YAxisOrientation.LEFT, x_axis_scale=PlotAxisScale.AUTO, y_axis_scale=PlotAxisScale.LINEAR, x_axis_label=None, y_axis_label=None, color_by=None, bounds=None, color_by_category=True, show_title=True, show_description=True, colors=None, advanced_tooltip=None, lines=None, legend=None, **kwargs)
Generates a Plot for using Virtualitics AI Platforms’s Visualization Framework.
- Parameters:
plot_type (
PlotType)data_frame (
Union[Dataset,DataFrame]) – The data that should be plotted. NOTE: Rows with NaN will be filtered out.x_axis_key (
str) – The name of the column for the X-Axis.y_axis_key (
str) – The name of the column for the Y-Axis.plot_title (
str) – The title of the plot.plot_description (
str) – The description of the plot, defaults to “”.show_tooltip (
bool) – whether to show the tooltip, defaults to True.include_keys_tooltip (
Optional[List[str]]) – Keys to include on tooltip, defaults to all keys.exclude_keys_tooltip (
Optional[List[str]]) – Keys to exclude on tooltip, defaults to including all keys.x_axis_orientation (
XAxisOrientation) – The orientation of the X-Axis, defaults to XAxisOrientation.BOTTOM.y_axis_orientation (
YAxisOrientation) – The orientation of the Y-Axis, defaults to YAxisOrientation.LEFT.x_axis_scale (
PlotAxisScale) – The scale of the X-Axis, defaults to PlotAxisScale.LINEAR.y_axis_scale (
PlotAxisScale) – The scale of the Y-Axis, defaults to PlotAxisScale.LINEAR.x_axis_label (
Optional[str]) – The label for the X-axis, defaults to the x_axis_key.y_axis_label (
Optional[str]) – The label for the Y-axis, defaults to the y_axis_key.color_by (
Optional[str]) – The column to use to color the plot if coloring. Defaults to None (no coloring).bounds (
Optional[Dict[str,List[Union[str,int]]]]) – The bounds of the data range if they should be manually set. This is a dict that contains they key as a string and a list of two numbers as min and max range. A list of strings is also accepted for categorical values. For example {x_axis_key: [0, 100], y_axis_key: [50, 200]}color_by_category (
bool) – When true, the color by axis will be categorical (if set).show_title (
bool)show_description (
bool)colors (
Optional[List[str]]) – The hex color schema a plot should use, defaults to None (Virtualitics AI Platform default colors).advanced_tooltip (
Optional[Callable[[dict],List[Union[Element,str]]]]) – The function to call that creatse an advanced tooltip. This functions takes a dict containing the data point and returns a list of elements (Plots, Infographics Tables, Infographics, CustomEvents) or strings which are rendered as markdown, defaults to Nonelines (
Optional[List[Dict[str,Union[LineType,str,Any]]]]) – A list of dictionaries containing information on parameters for the creation of a line on the plot. Each dictionary in the list denotes a different line. The currently supported line types are ‘horizontal’, ‘vertical’, and ‘linear’, where a ‘linear’ line denotes a linear trend line fitted to the data. The dictionary must be specify the line type using a LineType enum and can specify additional parameters relevant each line type. See the constructors for the HorizontalLine, VerticalLine, and OLSTrendLine for more information. For exmaple, a dictionary for a linear trend line could look like: {“type”: LineType.LINEAR, “description”: “My trendline”, “time_series_unit”: pd.Timedelta(“1 hours”)}.legend (
Optional[List[str]]) – A list to represent the order and labels on the legend. Will default to order present in plot data.
- Return type:
- Returns:
A Plot with the specification from above.
- virtualitics_sdk.utils.viz_utils.create_scatter_plot(data_frame, x_axis_key, y_axis_key, plot_title, plot_description='', show_tooltip=True, include_keys_tooltip=None, exclude_keys_tooltip=None, x_axis_orientation=XAxisOrientation.BOTTOM, y_axis_orientation=YAxisOrientation.LEFT, x_axis_scale=PlotAxisScale.AUTO, y_axis_scale=PlotAxisScale.LINEAR, x_axis_label=None, y_axis_label=None, color_by=None, bounds=None, color_by_category=True, show_title=True, show_description=True, colors=None, advanced_tooltip=None, lines=None, legend=None, **kwargs)
Generates a Scatter Plot for using Virtualitics AI Platform’s Visualization Framework.
- Parameters:
data_frame (
Union[Dataset,DataFrame]) – The data that should be plotted. NOTE: Rows with NaN will be filtered out.x_axis_key (
str) – The name of the column for the X-Axis.y_axis_key (
str) – The name of the column for the Y-Axis.plot_title (
str) – The title of the plot.plot_description (
str) – The description of the plot, defaults to “”.show_tooltip (
bool) – whether to show the tooltip, defaults to True.include_keys_tooltip (
Optional[List[str]]) – Keys to include on tooltip, defaults to all keys.exclude_keys_tooltip (
Optional[List[str]]) – Keys to exclude on tooltip, defaults to including all keys.x_axis_orientation (
XAxisOrientation) – The orientation of the X-Axis, defaults to XAxisOrientation.BOTTOM.y_axis_orientation (
YAxisOrientation) – The orientation of the Y-Axis, defaults to YAxisOrientation.LEFT.x_axis_scale (
PlotAxisScale) – The scale of the X-Axis, defaults to PlotAxisScale.AUTO.y_axis_scale (
PlotAxisScale) – The scale of the Y-Axis, defaults to PlotAxisScale.LINEAR.x_axis_label (
Optional[str]) – The label for the X-axis, defaults to x_axis_key.y_axis_label (
Optional[str]) – The label for the Y-axis, defaults to y_axis_key.color_by (
Optional[str]) – The column to use to color the plot if coloring, defaults to None (no coloring).bounds (
Optional[Dict[str,List[Union[str,int]]]]) – The bounds of the data range if they should be manually set. This is a dict that contains they key as a string and a list of two numbers as min and max range. A list of strings is also accepted for categorical values, defaults to None. For example {x_axis_key: [0, 100], y_axis_key: [50, 200]}color_by_category (
bool) – When true, the color by axis will be categorical (if set).show_title (
bool)show_description (
bool)colors (
Optional[List[str]]) – The hex color schema a plot should use, defaults to None (Virtualitics AI Platform default colors).advanced_tooltip (
Optional[Callable[[dict],List[Union[Element,str]]]]) – The function to call that creatse an advanced tooltip. This functions takes a dict containing the data point and returns a list of elements (Plots, Infographics Tables, Infographics, CustomEvents) or strings which are rendered as markdown, defaults to Nonelines (
Optional[List[Dict[str,Union[LineType,str,Any]]]]) – A list of dictionaries containing information on parameters for the creation of a line on the plot. Each dictionary in the list denotes a different line. The currently supported line types are ‘horizontal’, ‘vertical’, and ‘linear’, where a ‘linear’ line denotes a linear trend line fitted to the data. The dictionary must be specify the line type using a LineType enum and can specify additional parameters relevant each line type. See the constructors for the HorizontalLine, VerticalLine, and OLSTrendLine for more information. For exmaple, a dictionary for a linear trend line could look like: {“type”: LineType.LINEAR, “description”: “My trendline”, “time_series_unit”: pd.Timedelta(“1 hours”)}.legend (
Optional[List[str]]) – A list to represent the order and labels on the legend. Will default to order present in plot data.
- Return type:
- Returns:
A newly created scatter plot.
EXAMPLE:
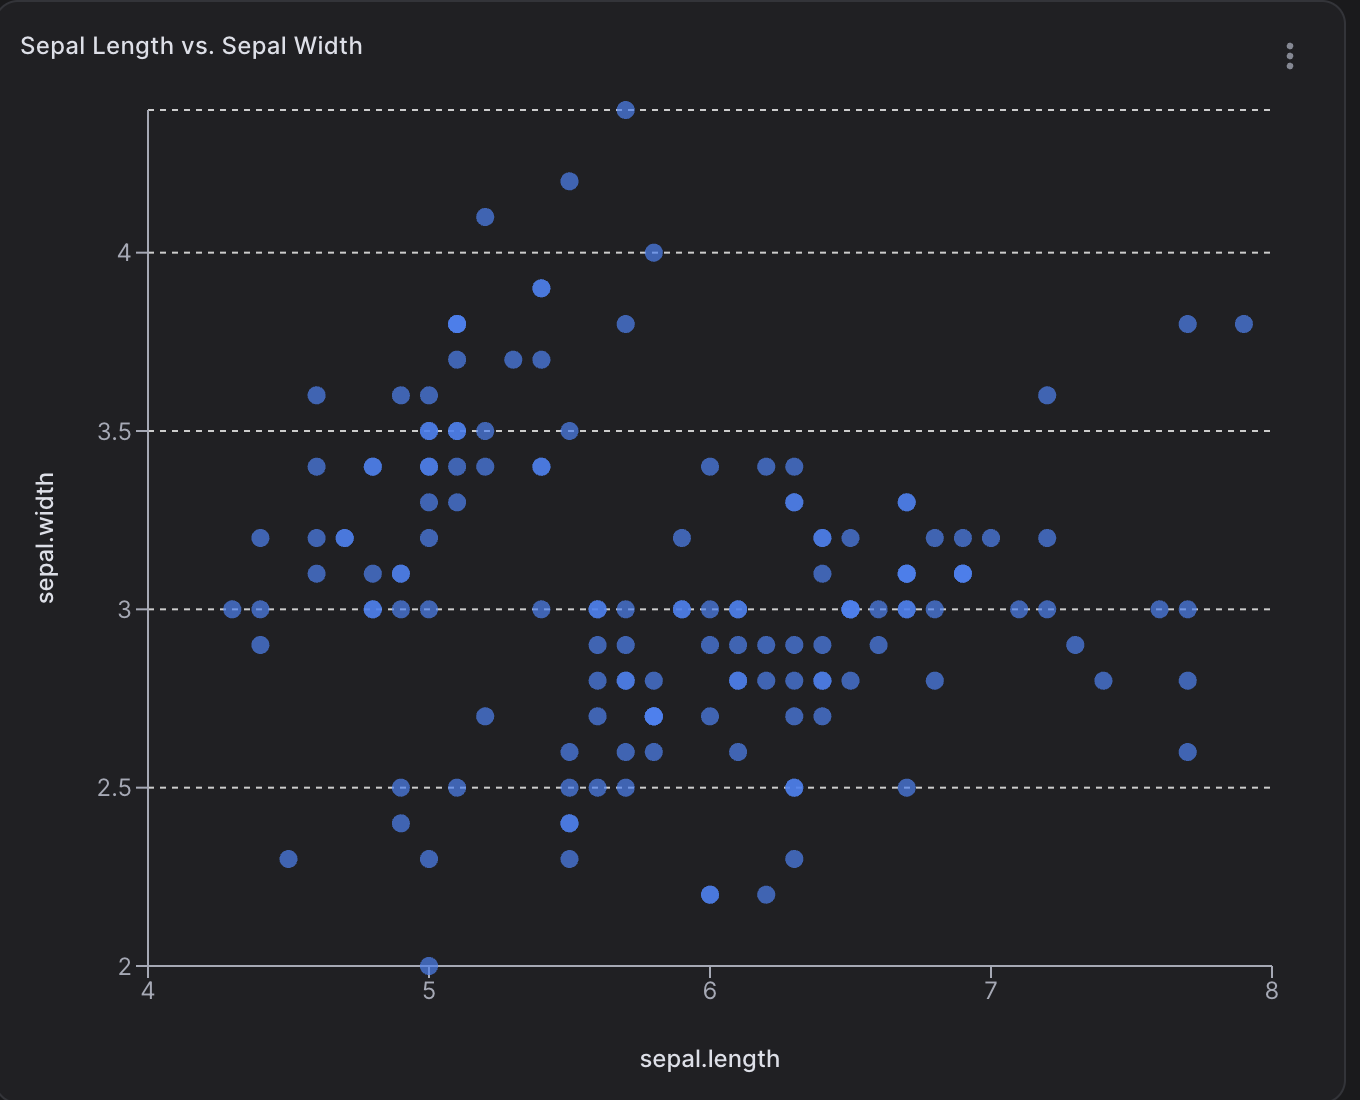
# Imports
from virtualitics_sdk import create_scatter_plot
. . .
df = pd.read_csv("some/example/path.csv")
ex_scatter_plot = create_scatter_plot(df,
                                      "sepal.length",
                                      "sepal.width",
                                      "Sepal Length vs. Sepal Width")
card = Card("",[ex_scatter_plot])
The above plot will be displayed as:
- virtualitics_sdk.utils.viz_utils.get_axis_domain(axis_key, data_keys, bounds)
- virtualitics_sdk.utils.viz_utils.get_bounds(bounds, key, _data_frame, y_axis_key, data_type, y_axis_scale, plot_type)