plotly_plot
- class virtualitics_sdk.elements.plotly_plot.PlotlyPlot(fig, title=None, show_title=True, description='', show_description=True)
Bases:
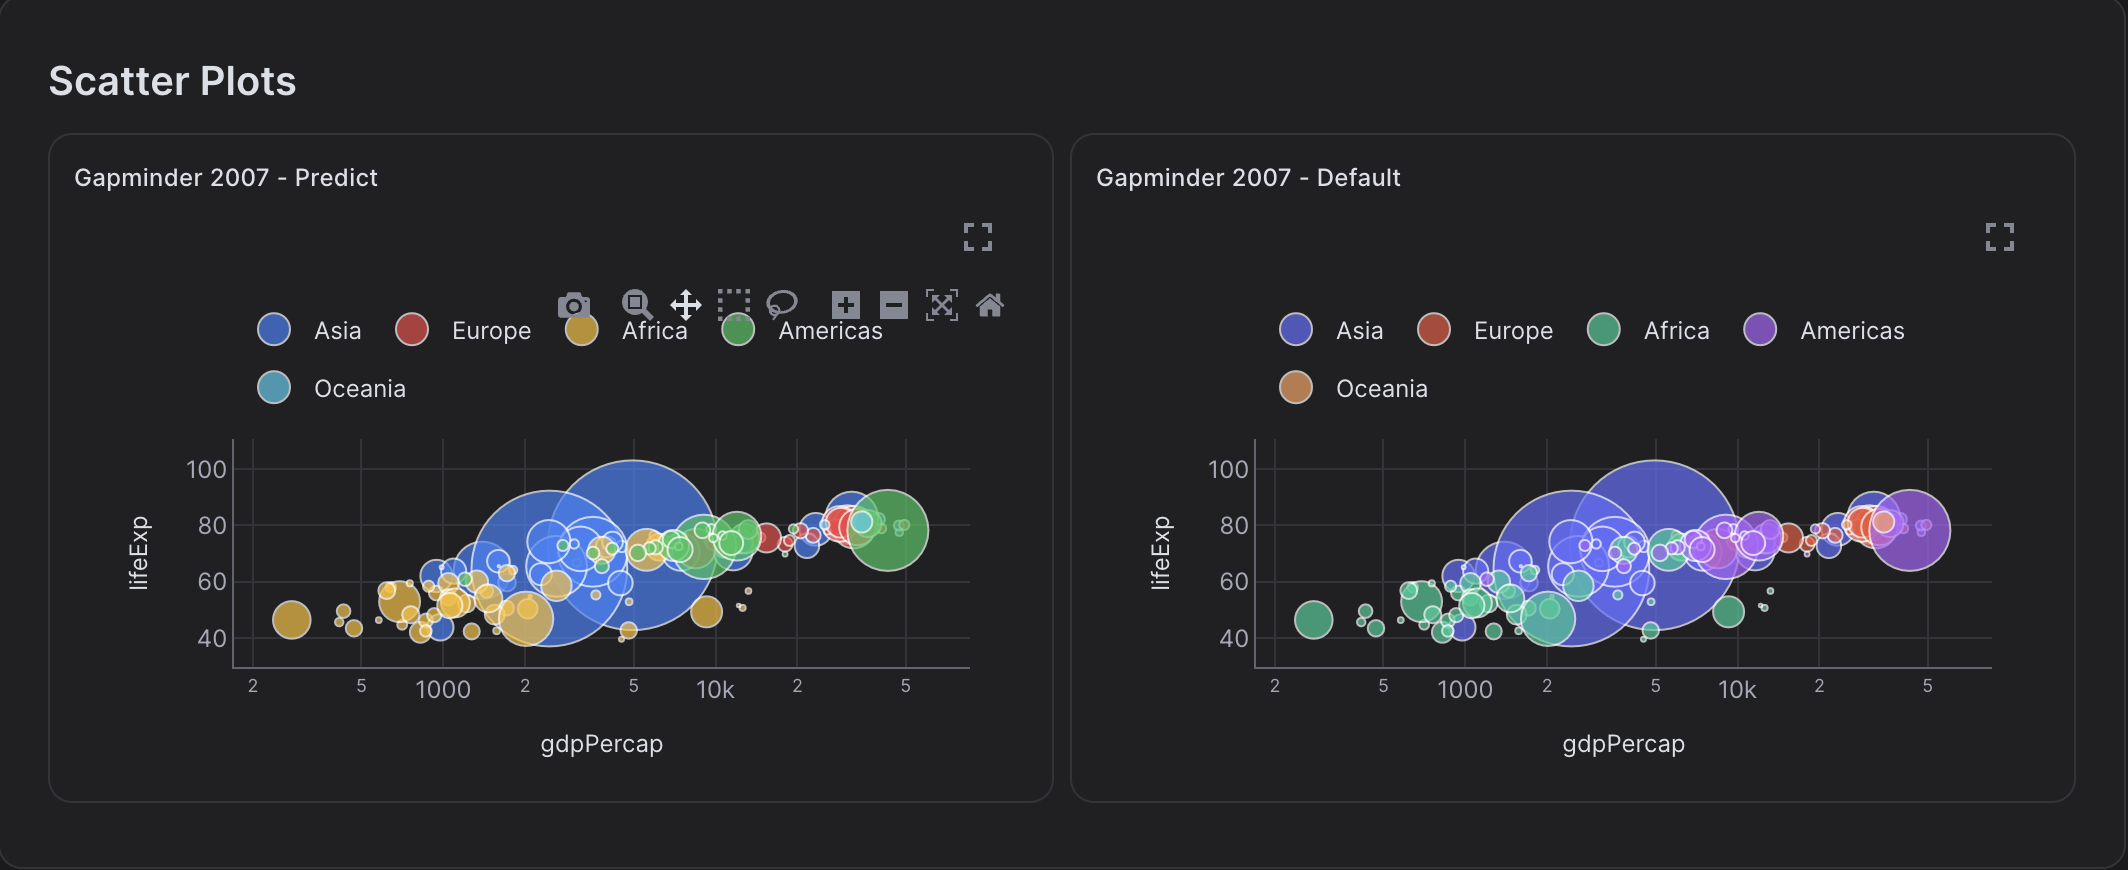
PlotCreate a plot using the Plotly package. On creation, the Plotly plot title will be remove and made into a VAIP title. To use the Virtualitics color scheme in Plotly plots simply add
template="predict_default"to the Plotly layout object and have the imported virtualitics_sdk plotly_plot module.NOTE: Plotly plot title will be removed and made into a VAIP title
More on Plotly documentation can be found here: https://plotly.com/python/
- Parameters:
fig (
Figure) – A Plotly figure objecttitle (
Optional[str]) – The title of the PlotlyPlot, if not specified, the title of object Plotly is used.show_title (
bool) – Whether to show the title on the page when rendered, defaults to True.description (
str) – The element’s description, defaults to ‘’.show_description (
bool) – Whether to show the description to the page when rendered, defaults to True.
EXAMPLE:
# Imports
from virtualitics_sdk import PlotlyPlot
. . .
# Example usage
class ExampleStep(Step):
  def run(self, flow_metadata):
    . . .
    fig_1 = px.scatter(ex_df,
                       x="gdpPercap",
                       y="lifeExp",
                       size="pop",
                       color="continent",
                       log_x=True, size_max=60,
                       template="predict_default",
                       title="Gapminder 2007 - Predict")
    fig_2 = px.scatter(ex_df,
                       x="gdpPercap",
                       y="lifeExp",
                       size="pop",
                       color="continent",
                       log_x=True,
                       size_max=60,
                       title="Gapminder 2007 - Default")
    pplot_1 = PlotlyPlot(fig_1)
    pplot_2 = PlotlyPlot(fig_2)
The above PlotlyPlot will be displayed as: