table
- class virtualitics_sdk.elements.table.SubTable(title='', description='', subtable=None)
Bases:
objectA SubTable that can be added to a
Tableelement. A SubTable for aTablecan provide additional insight for a chosen row in the form of a new table.- Parameters:
title (
str) – The title of the element, defaults to ‘’.description (
str) – The element’s description, defaults to ‘’.subtables – Function call that creates an expanded subtable. This function contains the StoreInterface and a dictionary containing the row data and returns a SubTable, defaults to None
EXAMPLE:
# Imports
from virtualitics_sdk import Table, SubTable
. . .
# Example usage
def generate_subtable(_: StoreInterface, row: dict):
     # Derive some columns to show in subtable
     dynamic_column1 = round(row["Length"] / row["Width"], 2)
     dynamic_column2 = round(row["Length"] / row["Height"], 2)
     # Add rows, 1st row is unique based on chosen Table row, 2-3 are static
     table = [
                 {
                   "Data Label": 'Unique Row Data',
                   "Length-Width Ratio": dynamic_column1,
                   "Length-Height Ratio": dynamic_column2
                 },
                 {
                   "Data Label": 'Mean',
                   "Length-Width Ratio": 1.91,
                   "Length-Width Ratio": 3.13
                 },
                 {
                   "Data Label": 'Median',
                   "Length-Width Ratio": 1.93,
                   "Length-Width Ratio": 3.34
                 }
     ]
     df = pandas.DataFrame(table)
     subtable = Table(df)
     return SubTable(title="Example SubTable",
                     description="",
                     subtable=subtable)
. . .
class ExampleStep(Step):
   def run(self, flow_metadata):
     . . .
     new_table = Table(pandas_df,
                       title="Example Table",
                       data_grid=True,
                       subtables=generate_subtable)
- class virtualitics_sdk.elements.table.Table(content, downloadable=False, filters_active=False, title='', description='', show_title=True, show_description=True, cell_colors=None, text_colors=None, column_descriptions=None, data_grid=False, searchable=True, expandable=True, missing_values=False, subtables=None, notes=None, links=None, show_filter=False, max_table_rows_to_display=2500, xlsx_config=None, editable=True, max_table_row_height=300, markdown_columns=None, missing_value_text=None, editable_columns=True)
Bases:
ElementA Table element.
- Parameters:
content (
Union[DataFrame,Dataset,Workbook]) – A DataFrame, Pandas series, or Dataset. Dataframes that have column with the reserved keyword id as their name are not supported and will raise an Exception.downloadable (
bool) – Whether this table should be downloaded, defaults to False.filters_active (
bool) – Whether the filters are active on this table, defaults to False.title (
str) – The title of the element, defaults to ‘’.description (
str) – The element’s description, defaults to ‘’.show_title (
bool) – Whether to show the title on the page when rendered, defaults to True.show_description (
bool) – Whether to show the description to the page when rendered, defaults to True.cell_colors (
Optional[DataFrame]) – Dataframe of cell colors as hex strings. Columns should exist inside source dataset, defaults to None, joined to in content dataframe by index. See code example below for usage.text_colors (
Optional[DataFrame]) – Dataframe of text colors as hex strings. Columns should exist inside source dataset, defaults to None, joined to in content dataframe by index. See code example below for usage.column_descriptions (
Optional[Dict[str,str]]) – Descriptions of the column of the inputs. These can be set for specific columns and must not be set for every column, defaults to None.data_grid (
bool) – Whether to show the datagrid version of a Table with advanced features, defaults to False.searchable (
bool) – When in datagrid mode, toggles the ability to search table values, defaults to True.expandable (
bool) – Whether a datagrid table has expandable rows, defaults to True.missing_values (
bool) – Set to true if this table contains missing values and you want to flag this to the user.subtables (
Optional[Callable[[StoreInterface,dict],SubTable]]) – Function call that creates an expanded subtable. This function contains the StoreInterface and a dictionary containing the row data and returns a SubTable, defaults to Nonenotes (
Optional[List[str]]) – The popover description that shows upon hovering over a particular row. Each index in the list maps to the corresponding row. Defaults to None.links (
Optional[List[str]]) – The link to redirect to when hovering over a particular row. Each index in the list maps to the corresponding row. Defaults to None.show_filter (
bool) – Whether to show the filter on the page when rendered, defaults to False.max_table_rows_to_display (
int) – Defaults to 2500 rows, this is the number of rows that will be sent to the frontend, however the entire table is downloadable from the frontend regardless of this limit. Browsers with more resources may be able to handle much larger limits than this default value.xlsx_config (
Dict) – dictionary of configurable parameters for tables that are backed by an xlsx objecteditable (
bool) – should this table be editable by the user from the frontend. This defaults to true.max_table_row_height (
int) – The maximum height of the table rows. Defaults to 300 characters.markdown_columns (
Union[List[str],bool,None]) – Only applies to data_grid tables. Controls which columns render their content as markdown. If None or an empty list ([]), no columns will render as markdown. If set to True, all columns will render as markdown. If set to a list of column names, only the specified columns will render as markdown, while others will render as plain textmissing_value_text (
str) – A string used to replace missing values (e.g., None, NaN, or NaT) in the table when rendered. Defaults to None, meaning missing values will remain as-is.editable_columns (
Union[List[str],bool,None]) – Controls which columns are editable within an editable data grid. If None, False, or an empty list ([]), no columns will be editable. If set to True, all columns will be editable. If set to a list of column names, only the specified columns will be editable. Defaults to True.
- Raises:
NotImplementedError – When table is created with invalid type.
EXAMPLE:
# Imports
from virtualitics_sdk import Table, PREDICT_ERROR_TEXT_COLOR
. . .
. . .
# Example usage
class ExampleStep(Step):
  def run(self, flow_metadata):
    . . .
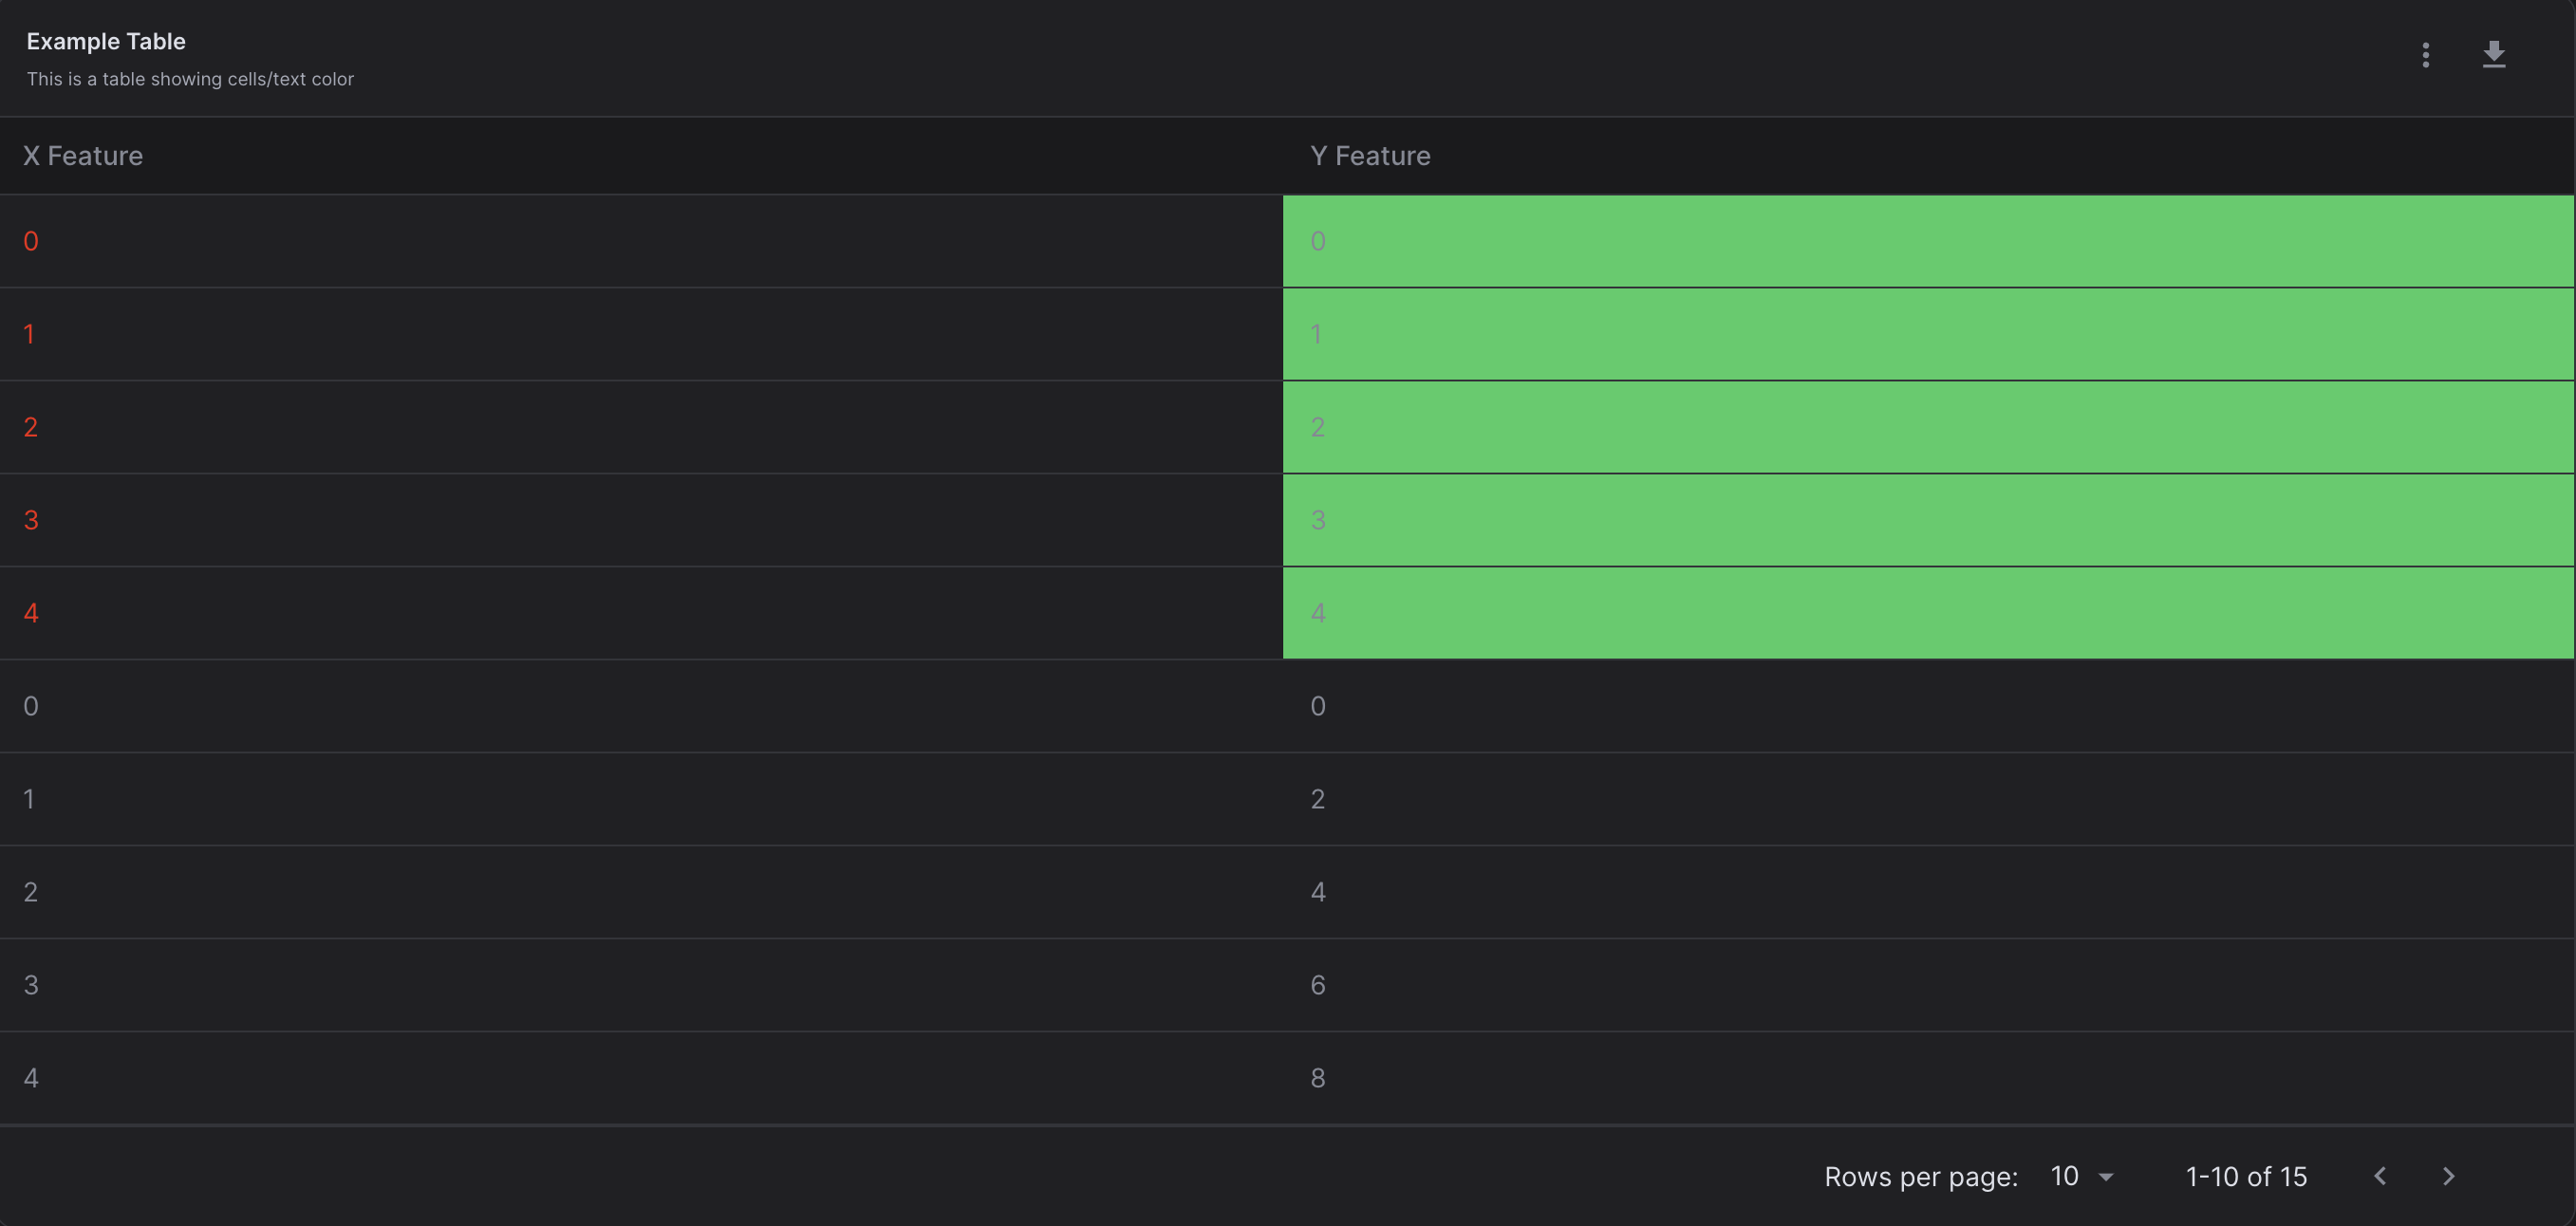
    point_per_cluster = 5 # Number of rows we want cell/text color to apply to
    cell_colors = pandas.DataFrame({"Y Feature": ["#39cd63"] * point_per_cluster})
    text_colors = pandas.DataFrame({"X Feature": ["#ee2310"] * point_per_cluster})
    table = Table(example_dataset,
            title="Example Table",
            description="This is a table showing cells/text color",
            downloadable=True,
            cell_colors=cell_colors,
            text_colors=text_colors)
The above Table will be displayed as:

